


This university project was split into two main parts, both based around data gathering. The first project used exsisting group research. 80 people were asked 'which colour?' and chose from set answers. For the second project, I based it on my habits as a student.
When researching into both subjects, I was able to gain visual representation of the research, such as when I looked into Pantone’s work and layout designs. I also think the artist research I did for the personal data outcome was helpful but also understand that I could have don’t more in this area.
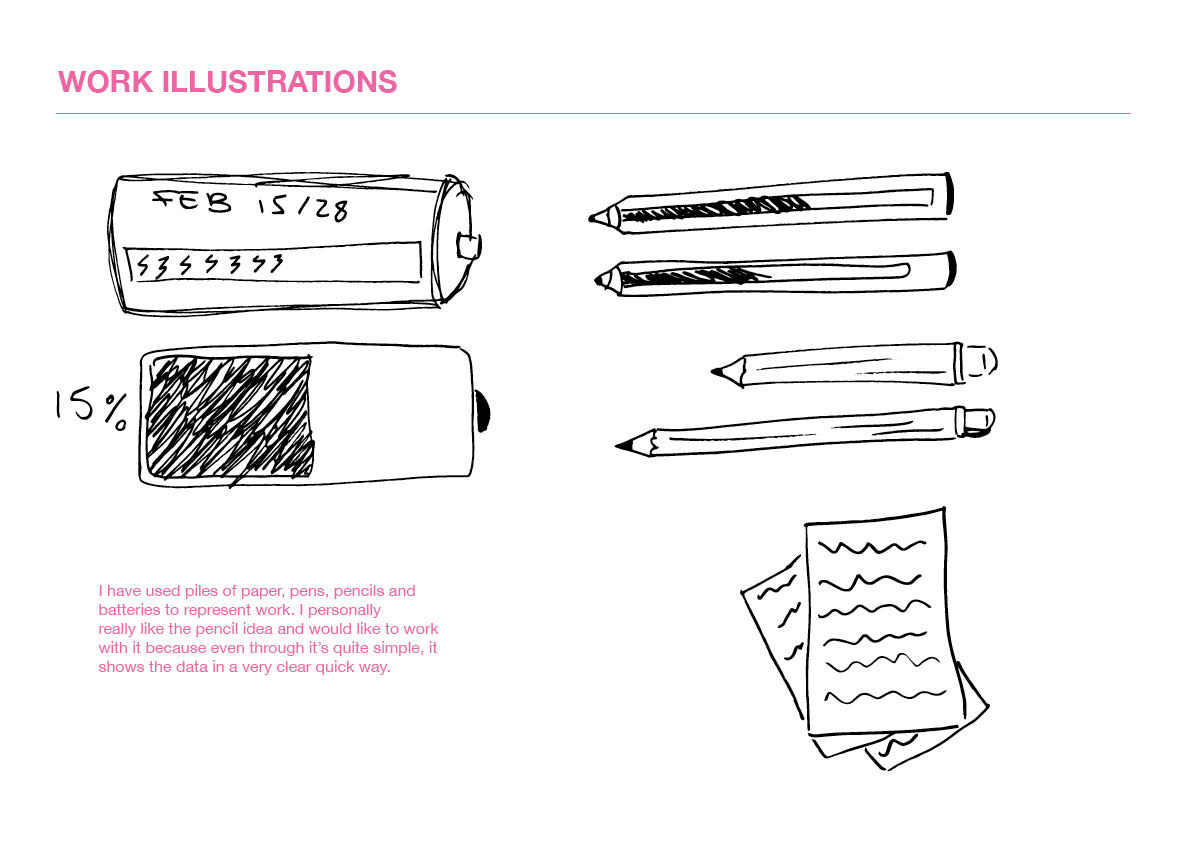
With the group data project, I relied on what my research gave me, for example different visuals, ways CMYK can be displayed and how Pantone uses compositions on their work, from this I was able to create my outcomes. With the personal data project, I started by creating my own visuals with icons to create the visual data. I was then able to devolve these into my final outcome.
I believe during this assignment, I have developed my skills using Illustrator a lot, before this project, I was still very new to the programme and only used the very basics, now I feel a lot more confident with it and would say my work had benefited from it. I also think my research skills were improved here as well as I think I did enough research to help with my work but also didn’t let it become too much and take away from the development time of the work.
I would say I’ve achieved between fair and good for this project. This is because I don’t think I did enough research into other designer and this could have improved my outcomes if I had done so. I also think I should have given more time to experimenting and developing both outcomes a bit more.